ArtsAutosBooksBusinessEducationEntertainmentFamilyFashionFoodGamesGenderHealthHolidaysHomeHubPagesPersonal FinancePetsPoliticsReligionSportsTechnologyTravel

How to interpret financial analysis ratios

Updated on February 29, 2016

A big part of conducting fundamental analysis of shares is calculating and interpreting financial analysis ratios.

Some ratios are shown in the pages of the Financial Times, others you will have to calculate yourself by reading the company accounts. Here is an explanation of the most popular ratios and how they are used.

The Price-Earnings Ratio

The Price-Earnings ratio (or P/E ratio) is the Share Price divided by the Earnings Per Share. The Earnings Per Share is the Net Profits after tax divided by the total number of shares the company has issued (to find this in the accounts, go to the Profit and Loss account - it is usually shown below the Net Profits After Tax). Because this is based on the last year's accounts, it is usually known as the historic Price/Earnings ratio (some financial analysts calculate the prospective P/E ratio based on what they think the company's future profits will be). Most newspapers print the historic P/E ratio next to the share price.

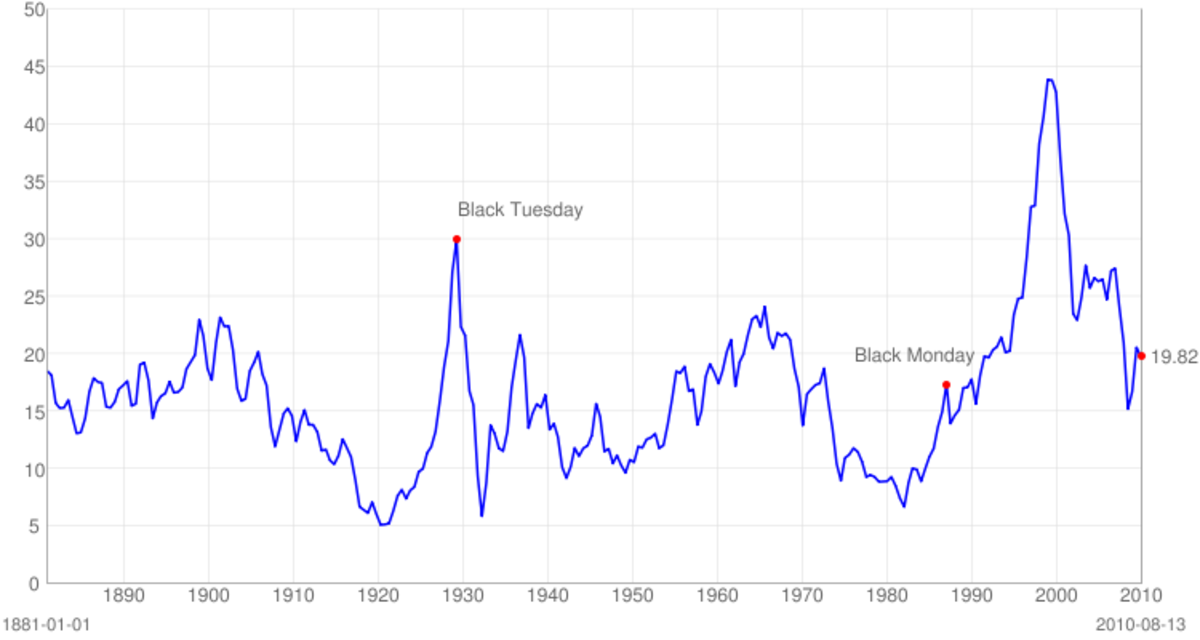
The P/E ratios for most shares are in the mid teens. To interpret the ratio, first check the P/E ratio's of other companies in the same sector, and look for the share you are examining to be in the same ball-park - if it is unusually high or low compared to the rest of the sector, you need to investigate further.

If a company has a low P/E ratio, but their earnings are rising year on year, then investigate to see if there is a reason that the share is undervalued. It might be that you've found a bargain, but it might be that the market is marking the share down because they are worried about something, perhaps a piece of news that has come out. If the P/E ratio is in the thirties, the share is very expensive. If you own the share, check the company's earnings potential. In order to sustain the share price they will need to make large increases in profit. If you think this is unlikely, sell.

The Dividend Yield

This is the dividend per share divided by the share price. Not all companies pay dividends, but it is a good sign if they do, as the dividend comes out of the profits after tax - which means that companies that pay dividends are invariably profitable. Further, once they start paying dividends companies will do anything to maintain it, knowing that their shares will get dumped by instituitional investors if they cut the dividend. Thus the dividend payment acts as a majpr discipline on companies.

If you are investing for income, the dividend yield becomes important as you will get a stream of income from a high yielding company that manages to pay their dividend year after year.

The Profit Margin

The Profit Margin: This is the Profits After Tax divided by the Turnover (Sales) figure, and then multiplied by 100 to convert to a percentage. The higher the profit margin the better. When doing your share analysis, calculate the profit margins of the main competitors to see how well the company is doing by comparison -  you want a company with a better profit margin than it's competitors. If a company has a profit margin of less than 5%, they are either either be in a very competitive sector with wafer-thin margins or they may be simply doing badly. As a general rule, avoid companies with very low profit margins - small downturns in the economy can push them into making losses.

Gearing Ratio

The Gearing ratio is the Total Debt divided by the Shareholders funds, and then multiplied by 100 to get a percentage. The higher the gearing ratio, the more precarious the company situation is. Total debt includes short-term debt - and in recessions, the companies that go bust are those who can't get their short-term debts rolled over by their banks. Companies with high gearing ratios can get into trouble during recessions when lending criteria suddenly tightens..

Debt to Equity ratio

This ratio looks at the long term debt. Find the long term liabilities in the balance sheet, and divide by the shareholders funds. Compare the ratio to competitors in the sector - if the company you are analysing has a higher debt to equity ratio than it's competitors. You are ideally looking for as low a ratio as possible..

Helpful pages:

Ideas for growth investing by Jim Slater

working

This website uses cookies

As a user in the EEA, your approval is needed on a few things. To provide a better website experience, hubpages.com uses cookies (and other similar technologies) and may collect, process, and share personal data. Please choose which areas of our service you consent to our doing so.

For more information on managing or withdrawing consents and how we handle data, visit our Privacy Policy at: https://corp.maven.io/privacy-policy

Show Details
Necessary
HubPages Device IDThis is used to identify particular browsers or devices when the access the service, and is used for security reasons.
LoginThis is necessary to sign in to the HubPages Service.
Google RecaptchaThis is used to prevent bots and spam. (Privacy Policy)
AkismetThis is used to detect comment spam. (Privacy Policy)
HubPages Google AnalyticsThis is used to provide data on traffic to our website, all personally identifyable data is anonymized. (Privacy Policy)
HubPages Traffic PixelThis is used to collect data on traffic to articles and other pages on our site. Unless you are signed in to a HubPages account, all personally identifiable information is anonymized.
Amazon Web ServicesThis is a cloud services platform that we used to host our service. (Privacy Policy)
CloudflareThis is a cloud CDN service that we use to efficiently deliver files required for our service to operate such as javascript, cascading style sheets, images, and videos. (Privacy Policy)
Google Hosted LibrariesJavascript software libraries such as jQuery are loaded at endpoints on the googleapis.com or gstatic.com domains, for performance and efficiency reasons. (Privacy Policy)
Features
Google Custom SearchThis is feature allows you to search the site. (Privacy Policy)
Google MapsSome articles have Google Maps embedded in them. (Privacy Policy)
Google ChartsThis is used to display charts and graphs on articles and the author center. (Privacy Policy)
Google AdSense Host APIThis service allows you to sign up for or associate a Google AdSense account with HubPages, so that you can earn money from ads on your articles. No data is shared unless you engage with this feature. (Privacy Policy)
Google YouTubeSome articles have YouTube videos embedded in them. (Privacy Policy)
VimeoSome articles have Vimeo videos embedded in them. (Privacy Policy)
PaypalThis is used for a registered author who enrolls in the HubPages Earnings program and requests to be paid via PayPal. No data is shared with Paypal unless you engage with this feature. (Privacy Policy)
Facebook LoginYou can use this to streamline signing up for, or signing in to your Hubpages account. No data is shared with Facebook unless you engage with this feature. (Privacy Policy)
MavenThis supports the Maven widget and search functionality. (Privacy Policy)
Marketing
Google AdSenseThis is an ad network. (Privacy Policy)
Google DoubleClickGoogle provides ad serving technology and runs an ad network. (Privacy Policy)
Index ExchangeThis is an ad network. (Privacy Policy)
SovrnThis is an ad network. (Privacy Policy)
Facebook AdsThis is an ad network. (Privacy Policy)
Amazon Unified Ad MarketplaceThis is an ad network. (Privacy Policy)
AppNexusThis is an ad network. (Privacy Policy)
OpenxThis is an ad network. (Privacy Policy)
Rubicon ProjectThis is an ad network. (Privacy Policy)
TripleLiftThis is an ad network. (Privacy Policy)
Say MediaWe partner with Say Media to deliver ad campaigns on our sites. (Privacy Policy)
Remarketing PixelsWe may use remarketing pixels from advertising networks such as Google AdWords, Bing Ads, and Facebook in order to advertise the HubPages Service to people that have visited our sites.
Conversion Tracking PixelsWe may use conversion tracking pixels from advertising networks such as Google AdWords, Bing Ads, and Facebook in order to identify when an advertisement has successfully resulted in the desired action, such as signing up for the HubPages Service or publishing an article on the HubPages Service.
Statistics
Author Google AnalyticsThis is used to provide traffic data and reports to the authors of articles on the HubPages Service. (Privacy Policy)
ComscoreComScore is a media measurement and analytics company providing marketing data and analytics to enterprises, media and advertising agencies, and publishers. Non-consent will result in ComScore only processing obfuscated personal data. (Privacy Policy)
Amazon Tracking PixelSome articles display amazon products as part of the Amazon Affiliate program, this pixel provides traffic statistics for those products (Privacy Policy)
ClickscoThis is a data management platform studying reader behavior (Privacy Policy)